ggplot2: Plot replication challenge!
2025-08-09
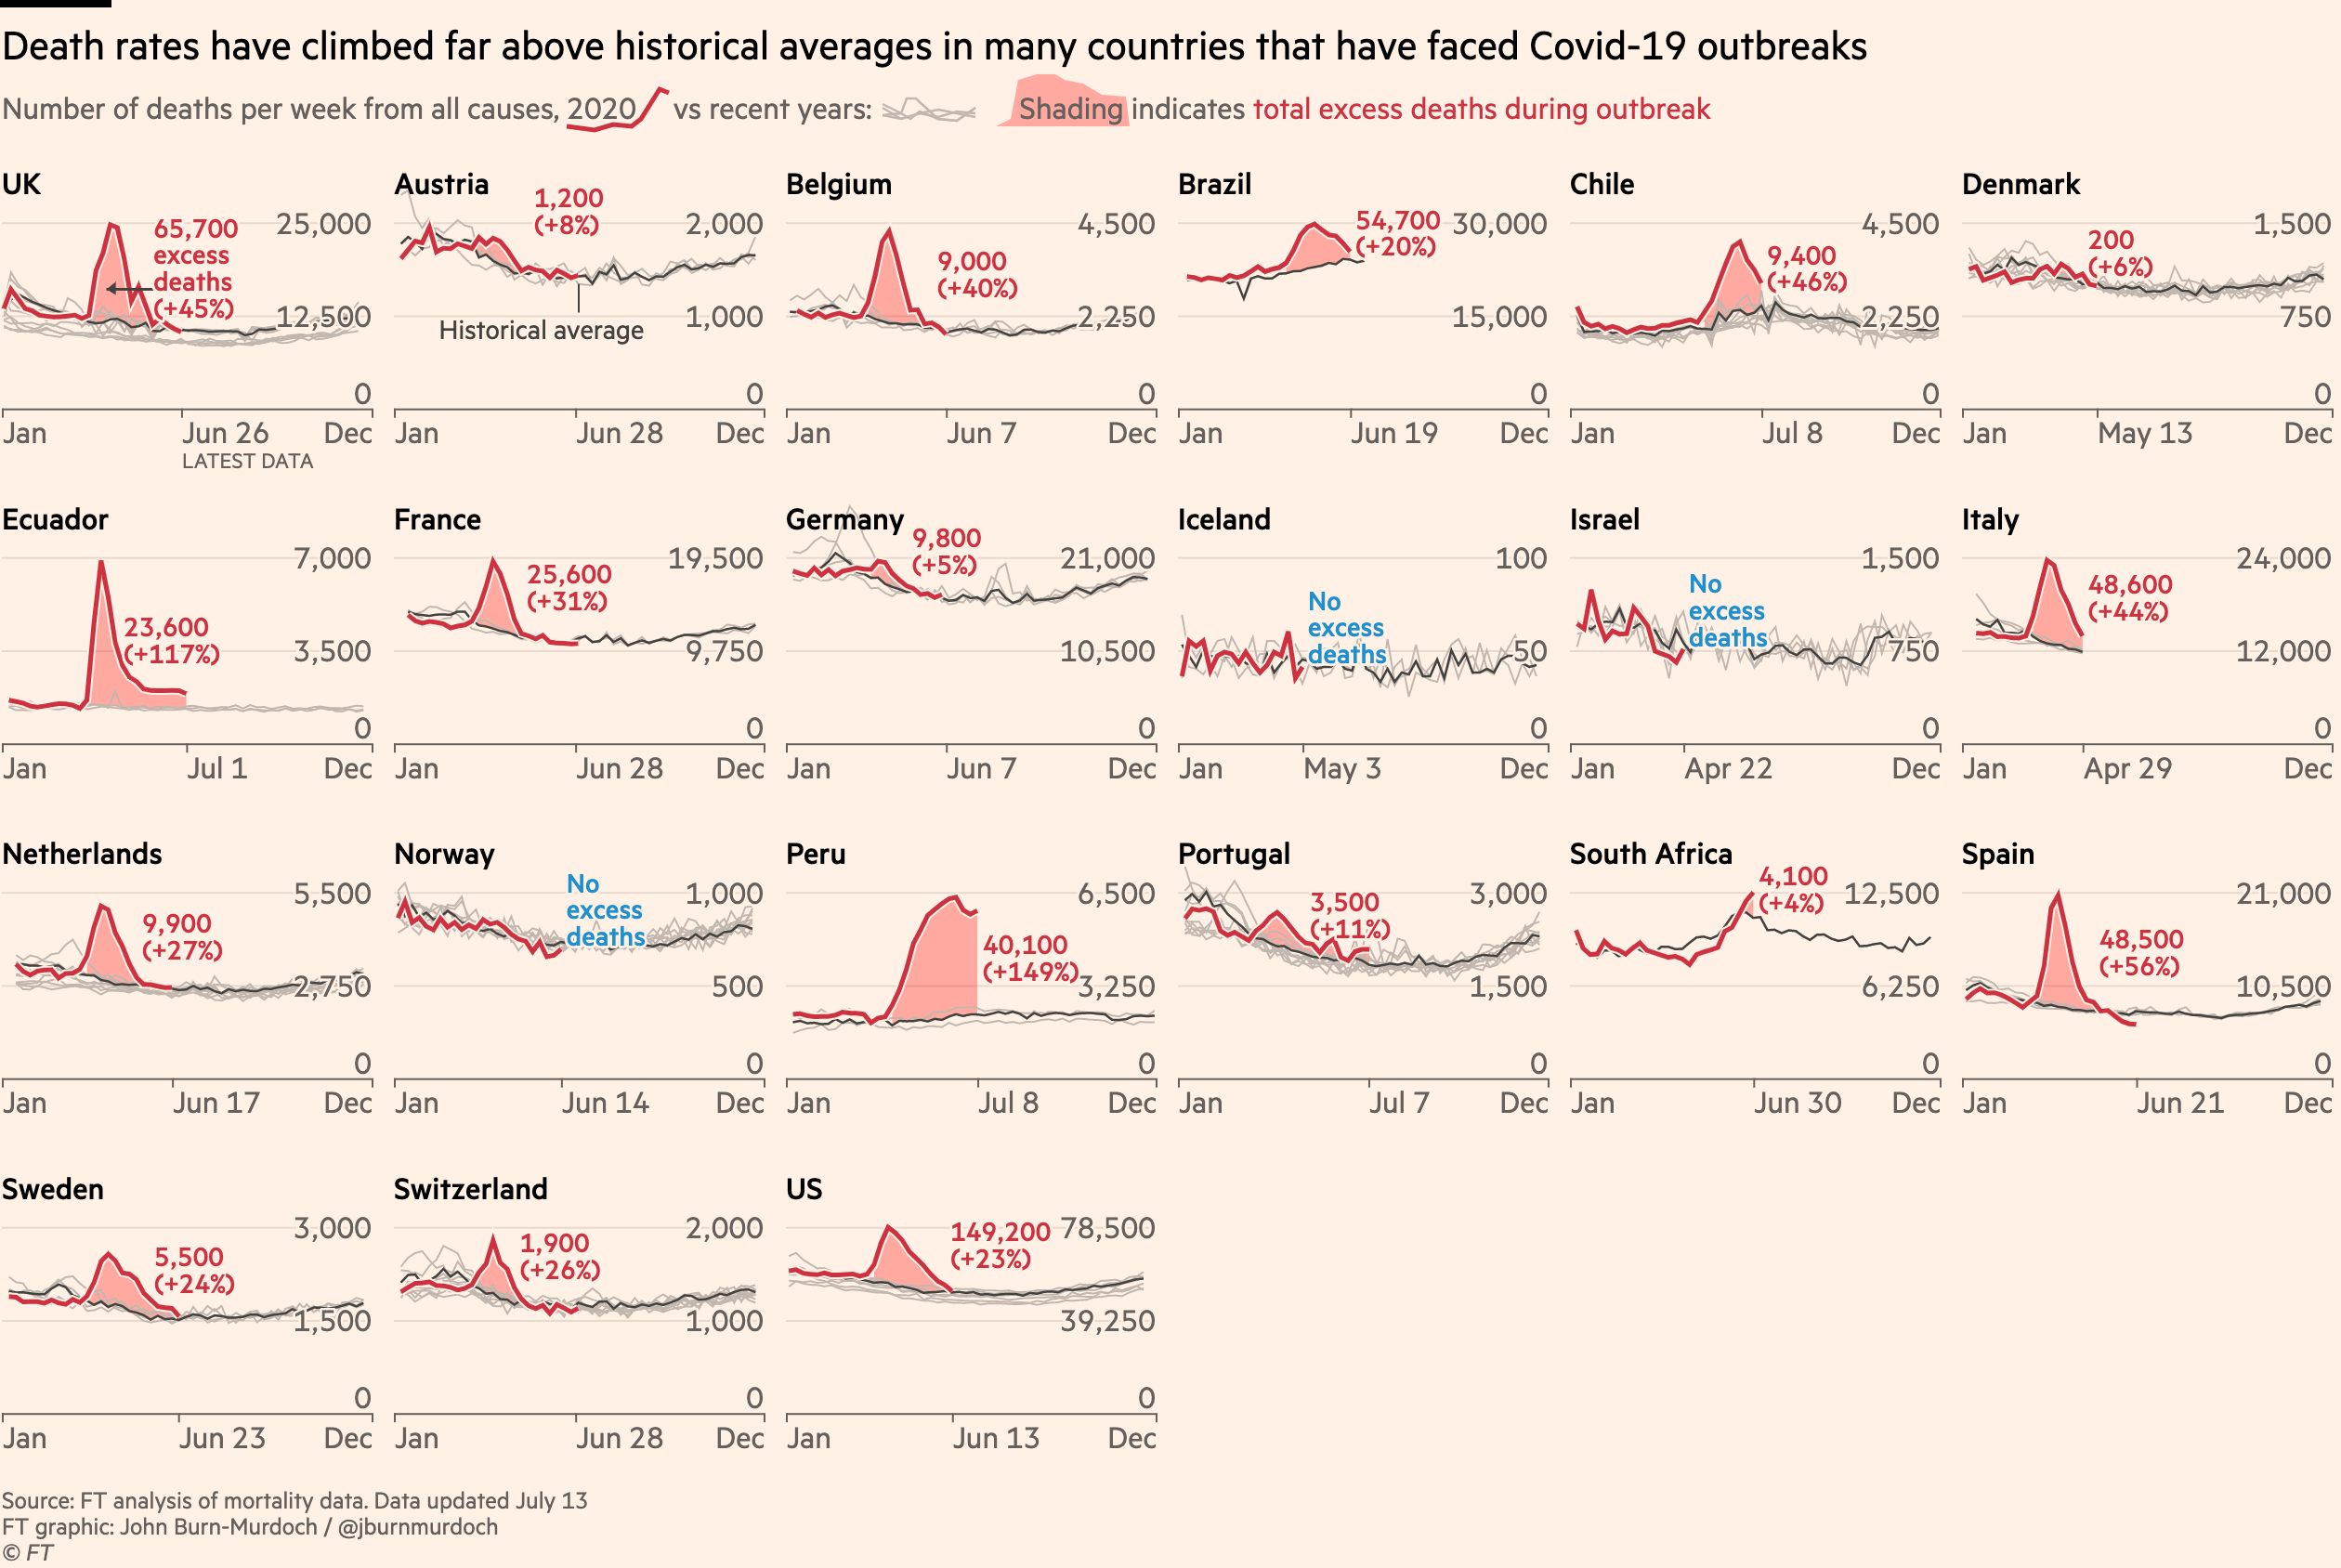
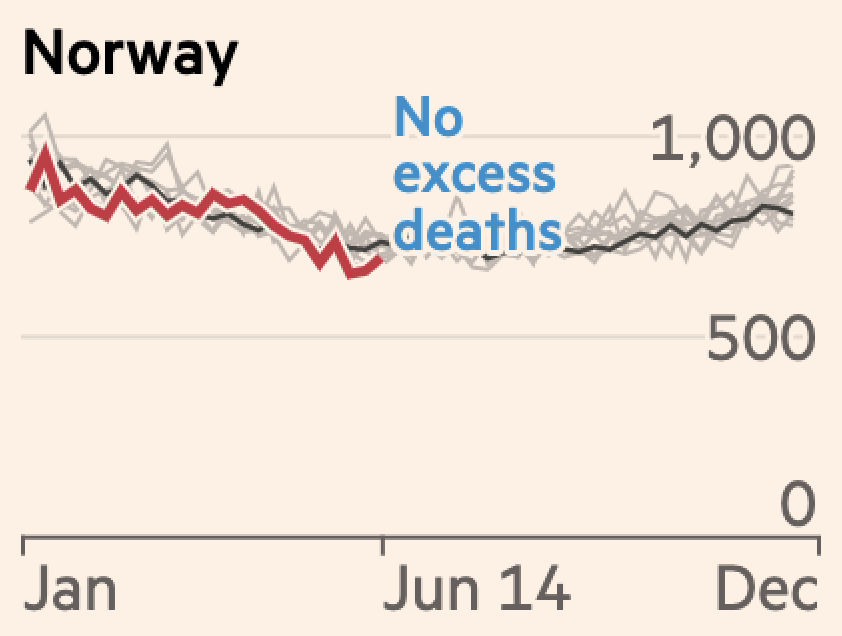
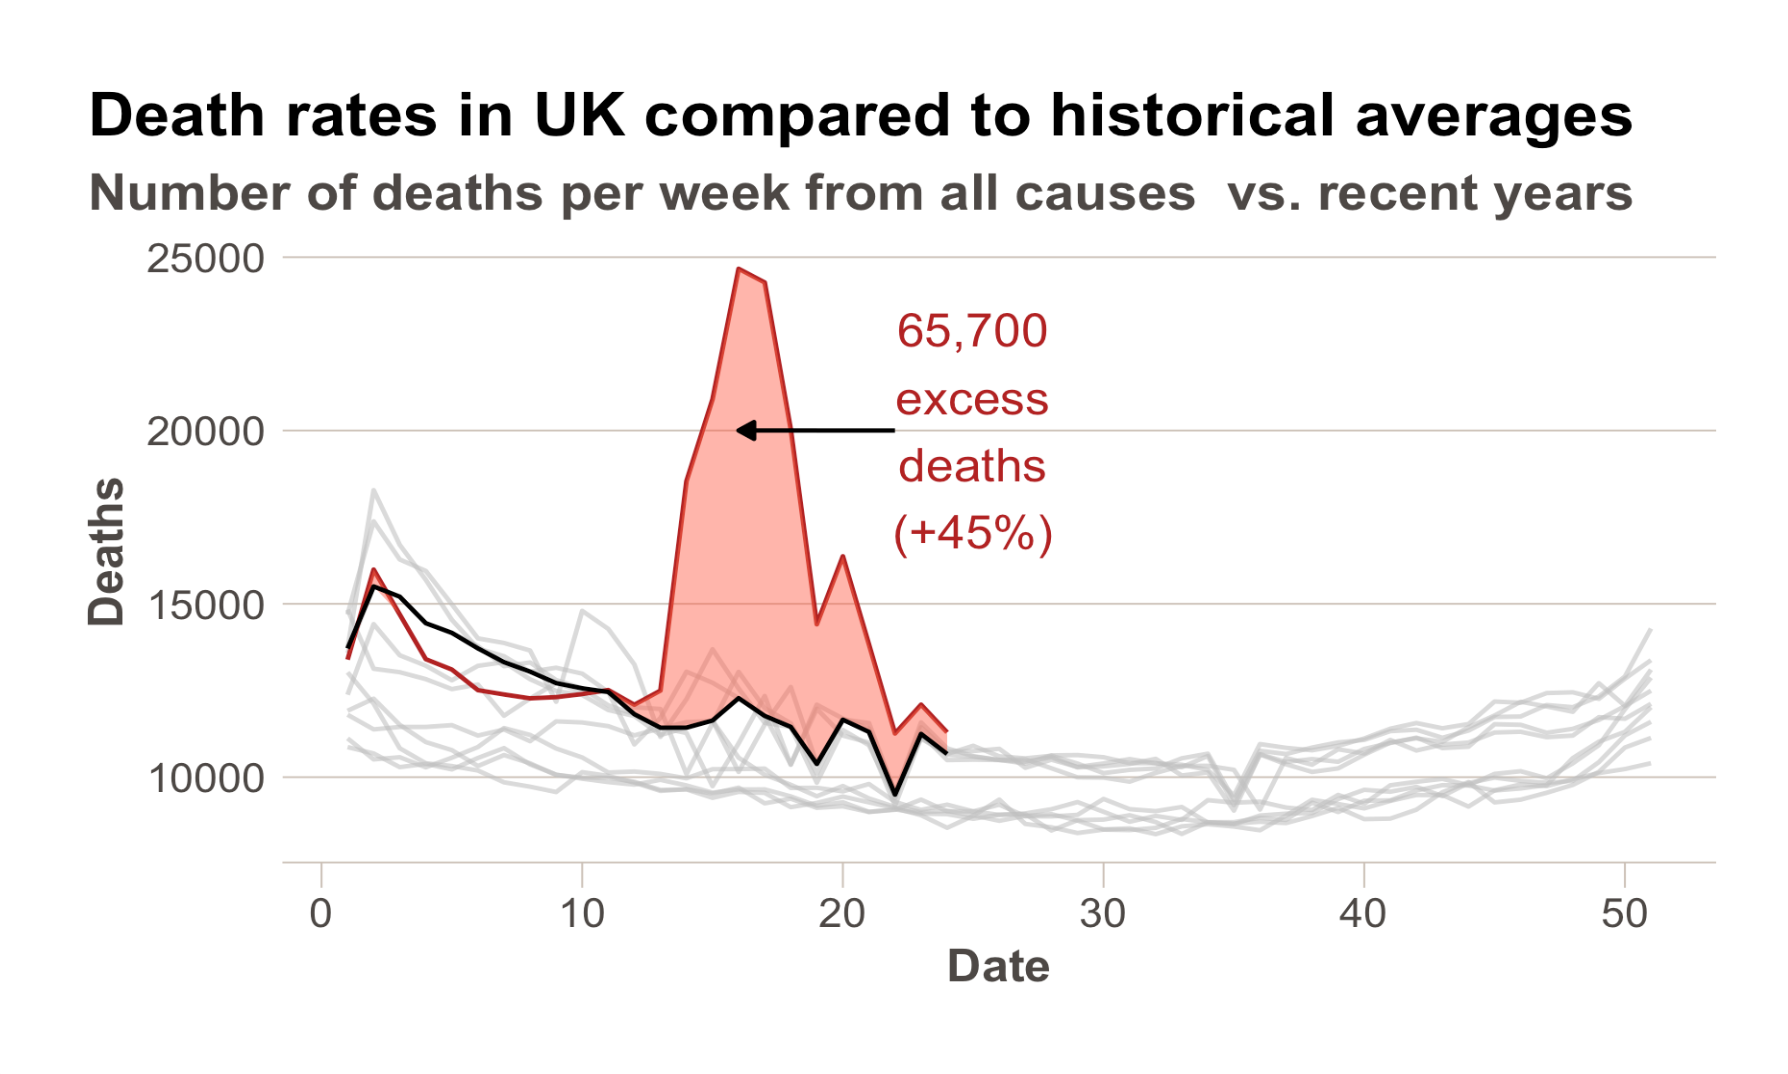
What’s this plot telling us?

What’s this plot telling us?

What’s this plot telling us?
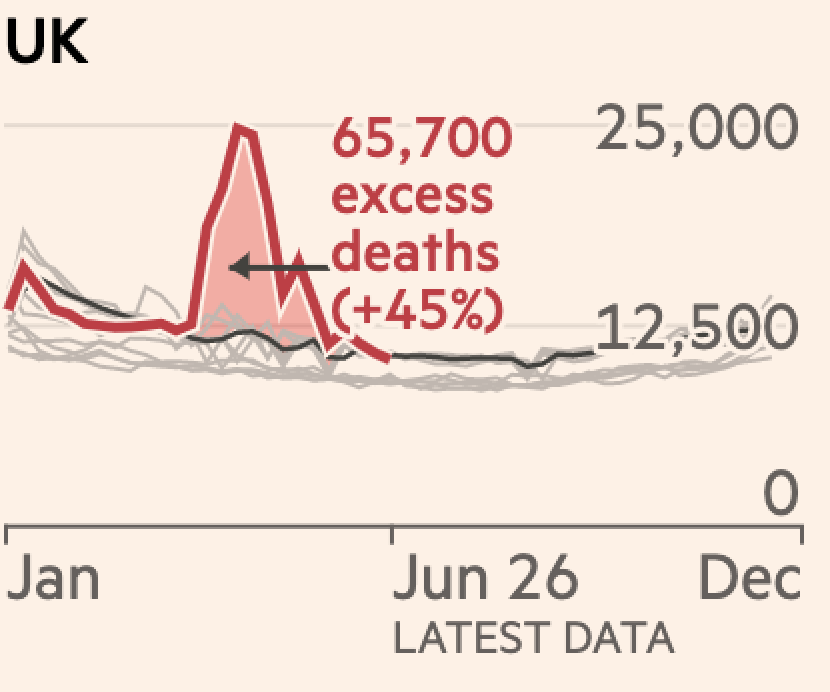
What’s this plot telling us?
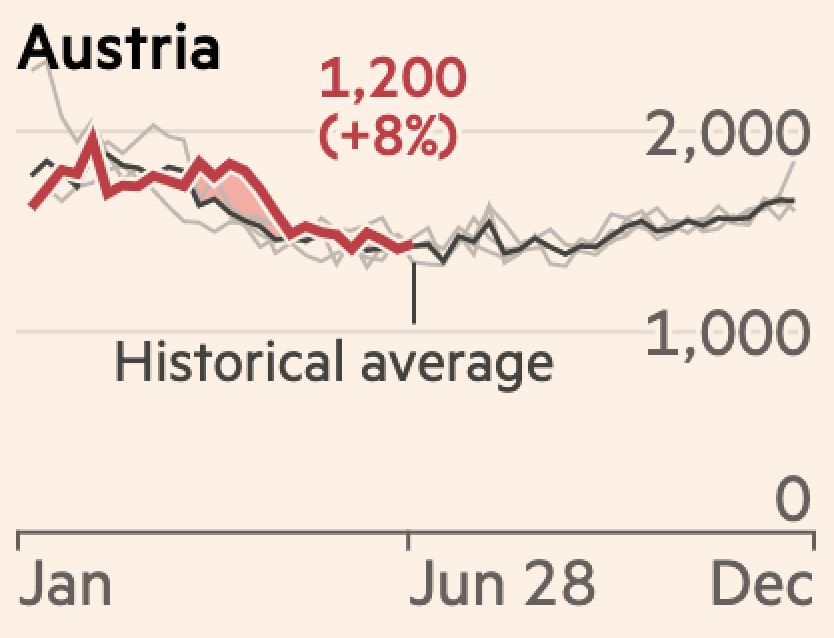
What’s this plot telling us?
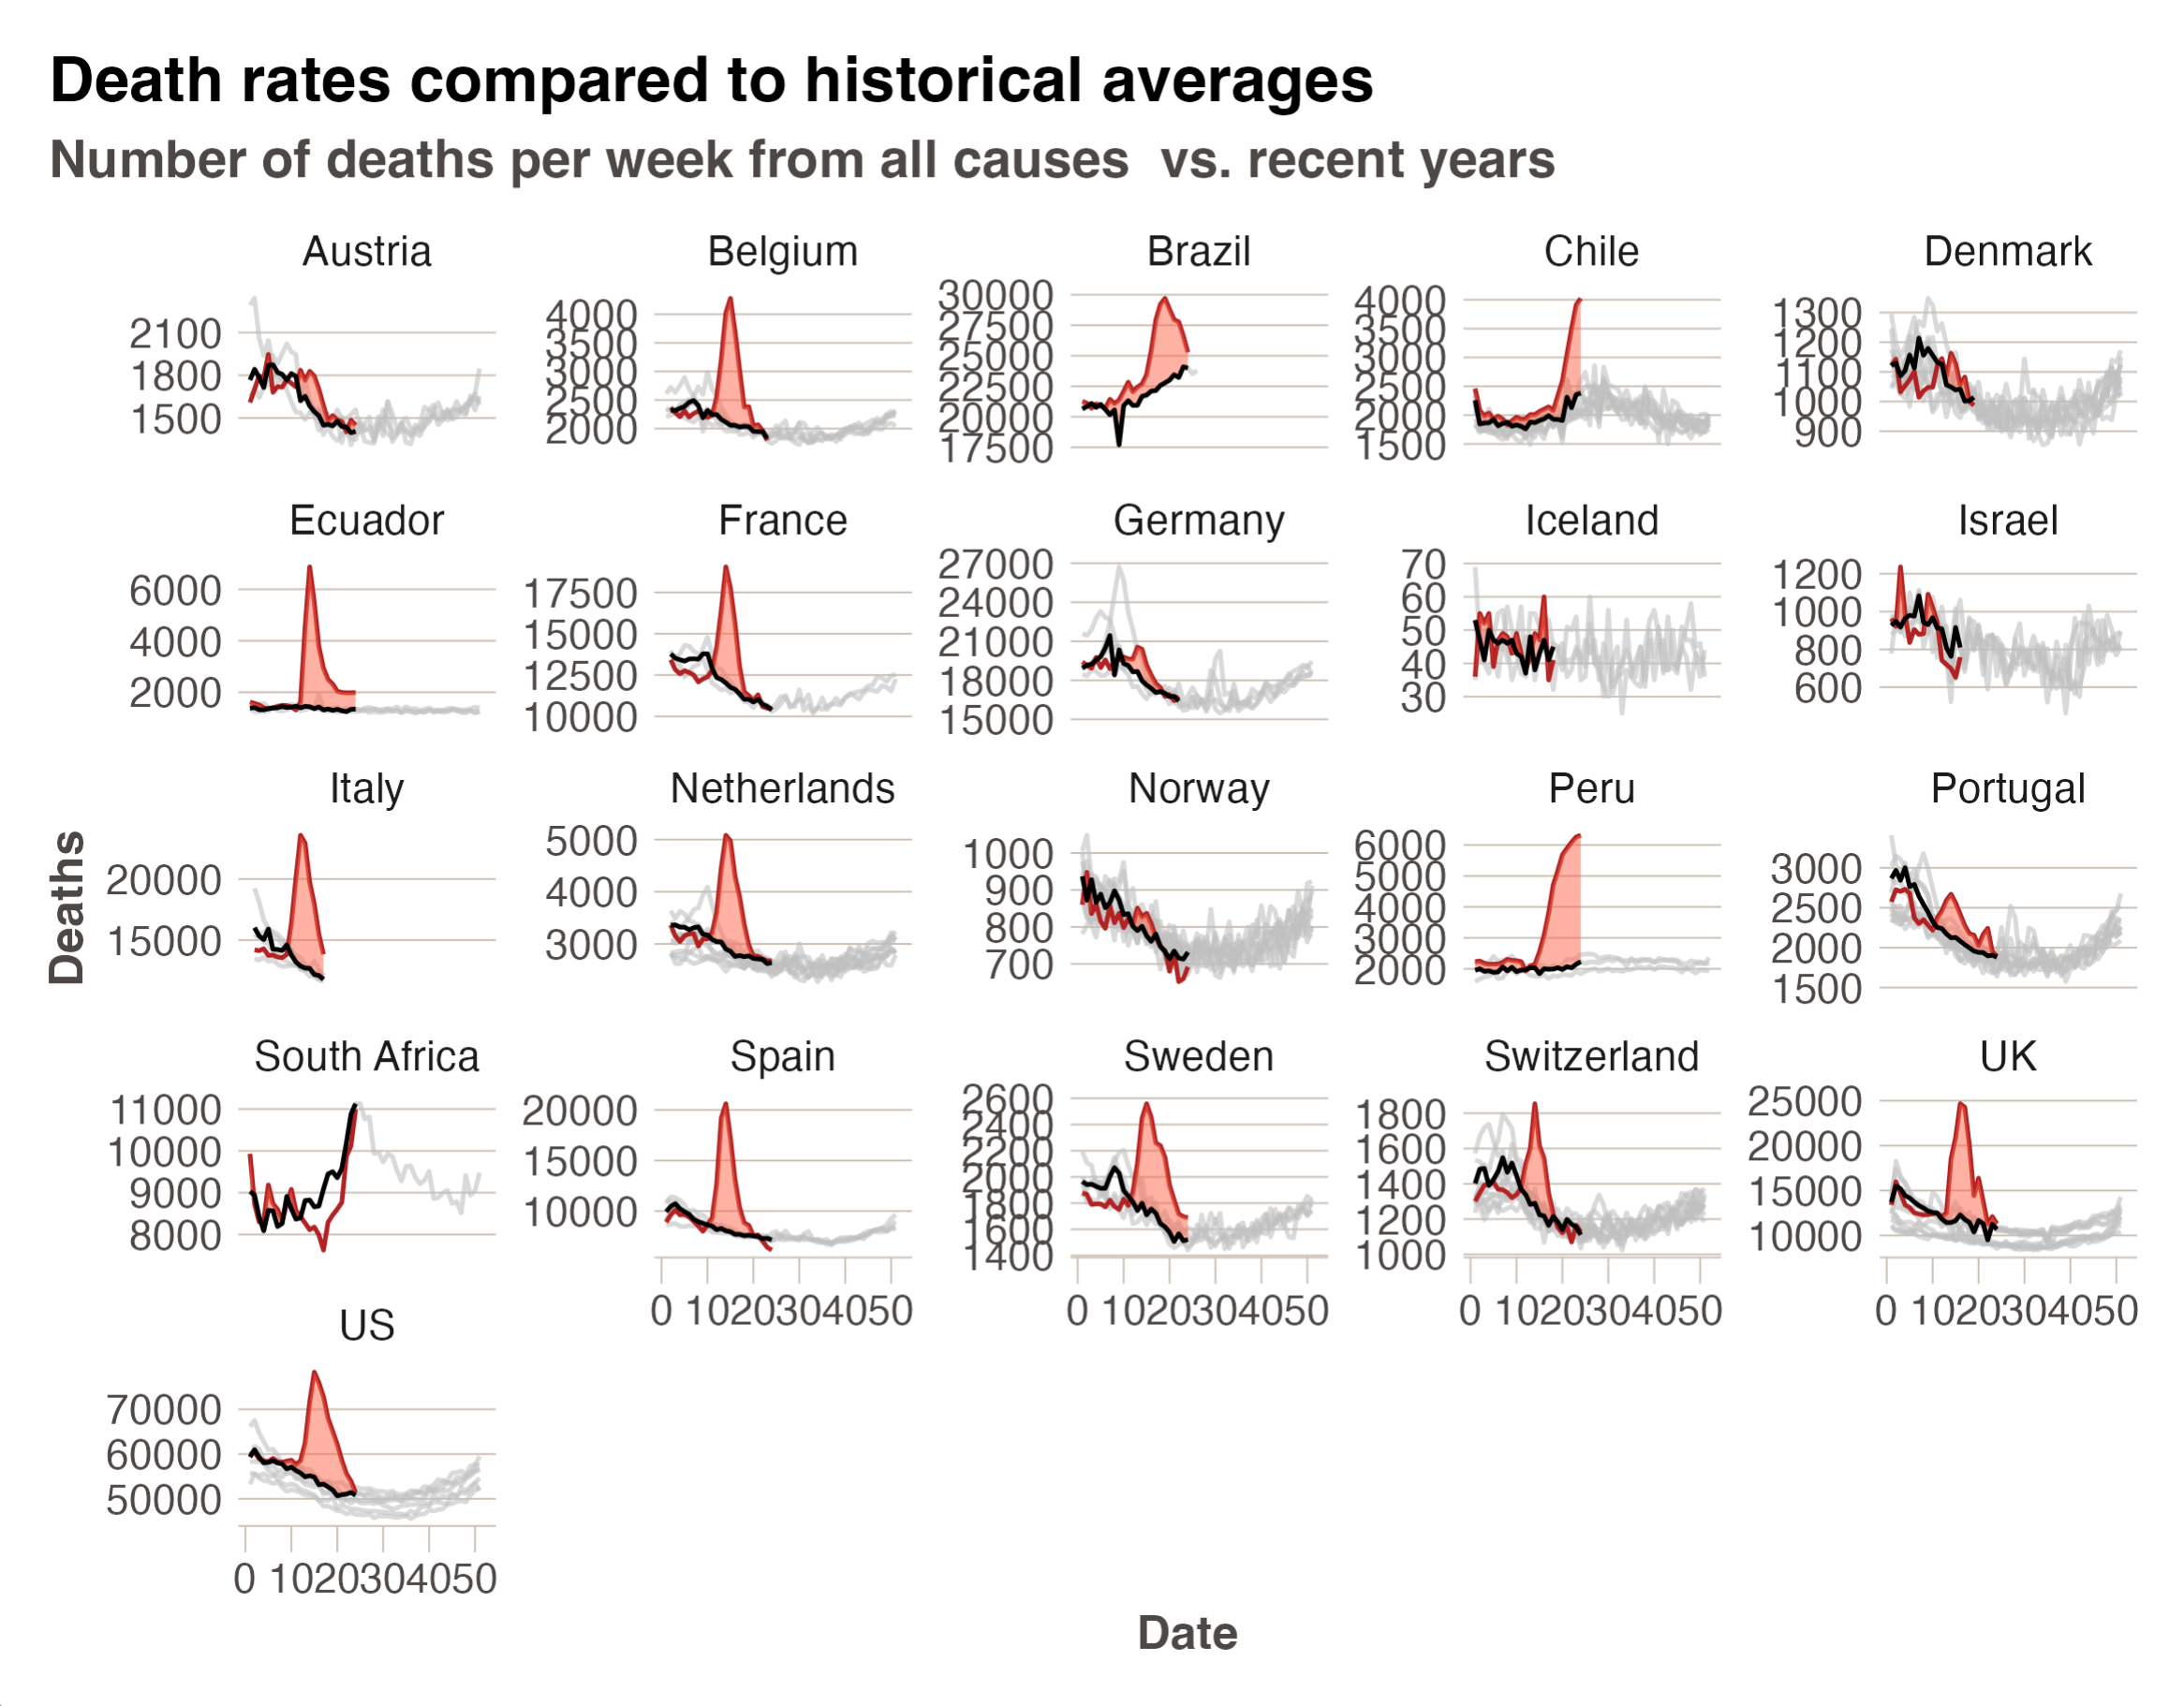
Our Goal for the Recreation
Our Goal for the Recreation
2025-08-09